Building a Real-World Monitoring Stack with Grafana & Prometheus


So I’m working on getting some more certs specifically AZ-800 and AZ-801 and I found myself wondering: How hard is it to join a Linux machine to Active Directory? And if I could do that, could I turn that machine into a Grafana server to monitor the rest of the servers in my home-lab?
I spun up an Ubuntu Server and joined it to my AD domain surprisingly easy, just a few straight forward commands. First we need to get time sync dialled in.
⏱️Configure Time Sync with chrony
Accurate time sync is essential for Kerberos authentication to work properly when joining a domain.
Install chrony:
sudo apt install chrony -y
Edit the chrony config:
sudo nano /etc/chrony/chrony.conf
At the top of the file, add your domain controller as the NTP source:
server dc01.cosmic.local iburst
Then restart the service:
sudo systemctl restart chrony
Check time sync status:
timedatectl status
chronyc sources
🧰Install Required Packages
sudo apt update
sudo apt install realmd sssd sssd-tools adcli samba-common-bin krb5-user -y
🔍Discover the Domain
realm discover cosmic.local
🔐Join the Domain
sudo realm join -U administrator cosmic.local
🏠Enable Home Directory Creation for Domain Users
sudo pam-auth-update --enable mkhomedir
🔎Verify the Join and Test AD Login
Check realm status:
realm list
Test domain user lookup:
id megatron@cosmic.local
Switch user:
su - megatron@cosmic.local
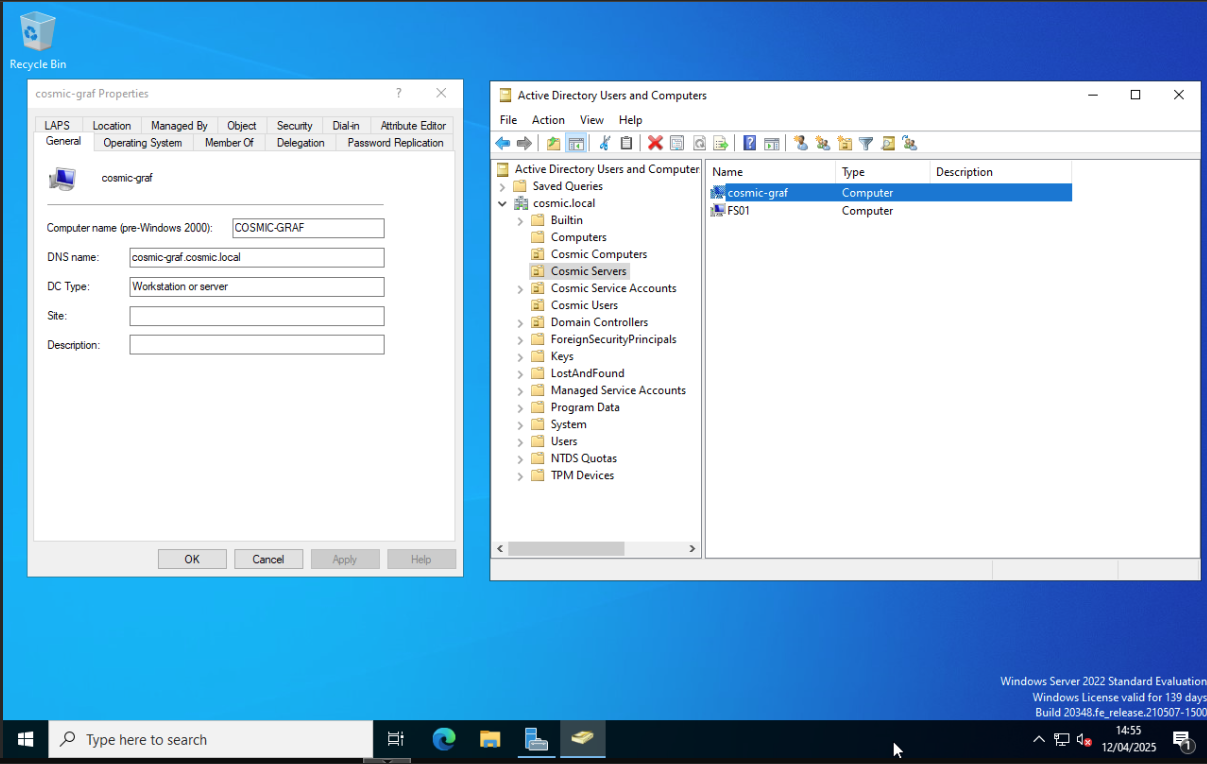
What really impressed me was being able to log into the Ubuntu box using any of my existing Active Directory accounts. I’d never seen a Linux device show up in AD before, let alone be able to access it with domain credentials.
grafana@cosmic-graf:~$ su - megatron@cosmic.local
Password:
megatron@cosmic-graf:~$ whoami
megatron@cosmic.local
megatron@cosmic-graf:~$ pwd
/home/megatron@cosmic.local
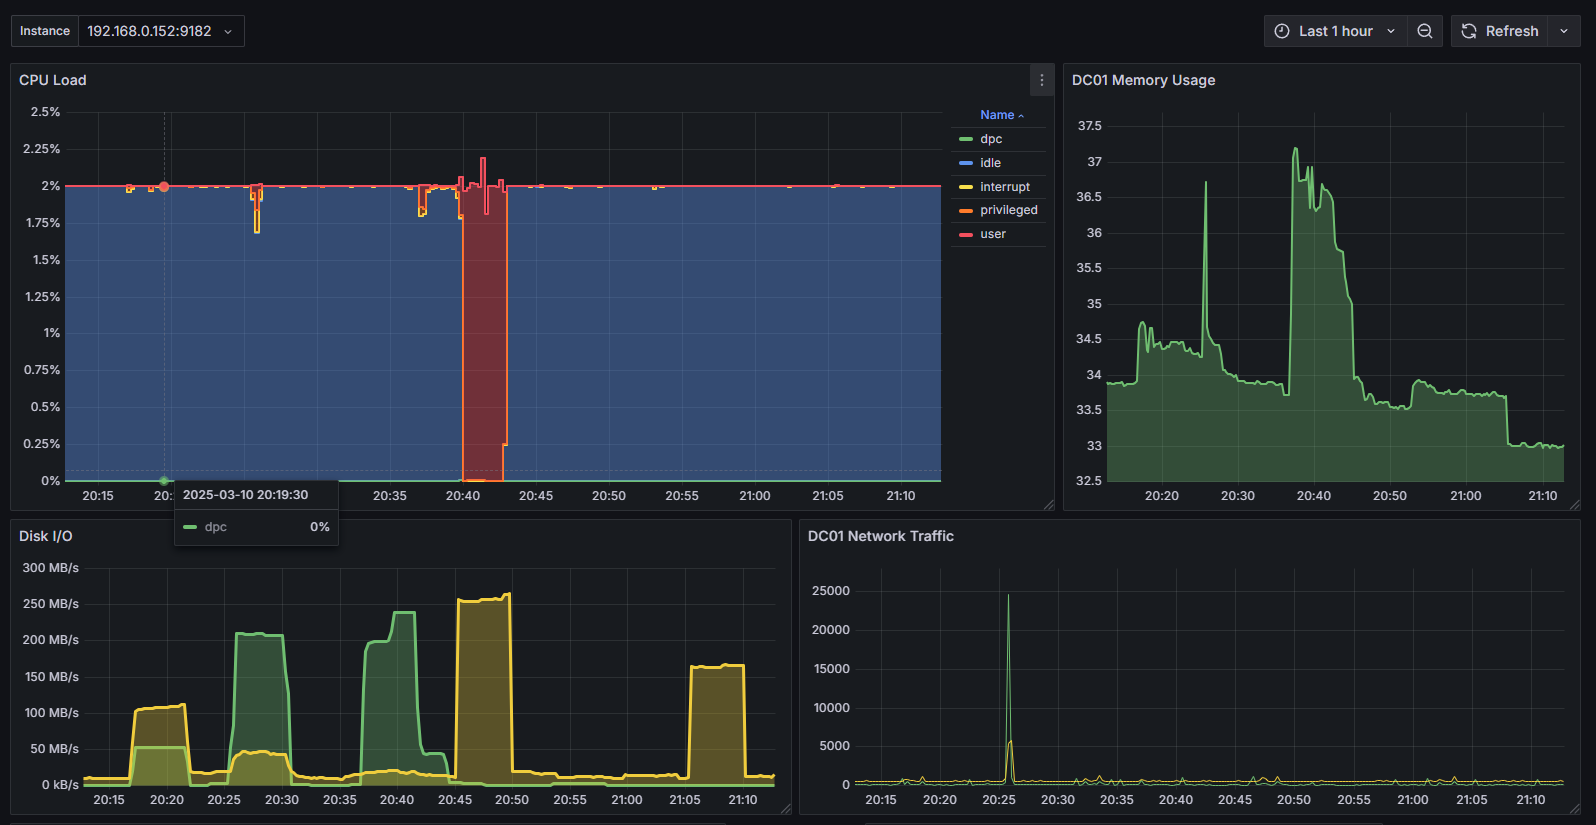
From there, I wired it up with Grafana and Prometheus. On the Windows side, I installed Windows Exporter on one of my Domain Controllers and opened up port 9182 so Prometheus could scrape metrics.
Once everything was talking, I started building the dashboard from scratch.
- CPU usage
- Memory usage
- Disk usage (C:)
- Network throughput
- Disk I/O (read/write bytes per second)
Everything’s clean, real-time, and actually useful.
I generated some fake CPU and disk load using PowerShell just to watch the graphs respond live.
This started as a cert-prep experiment, but it quickly turned into a deeper dive into how systems actually run behind the scenes. I love just messing around and building things, I always learn more by doing. Still rough around the edges, but that’s part of the fun.

